|
Introduction Carnegie Mellon University’s TRACES Lab (HCII/SOA) is exploring how to use emerging technologies to help spatially and temporally scaffold documentation practices in creative, constructive project-based learning experiences. Through a co-design process with Quaker Valley High School educators and administration, the project team has generated multiple proposals for connected technologies solutions to support documentation practices for their sophomore year Self Directed Learning (SDL) project experiences. In the first quarter of 2021, we developed a browser-based system for Quaker Valley students to submit their SDL evidence and view their progress. This post provides an overview of the technical implementation and details some of the decision points, challenges, and potential improvements. Quaker Valley schools bases at least part of their IT infrastructure on the Google Workspace suite of tools. Thus, in the interest of development time/cost and integration with existing systems employed at Quaker Valley, we tried to leverage existing Google tools/services when when making technology decisions. Evidence Submission Google Form We needed a simple and easy-to-user interface for students to upload their SDL evidence along with a few pieces of associated information. We quickly settled on a Google Forms solution since it satisfies all of the following with minimal effort:
We needed a solution that provides visibility of submitted data to both a student and the teacher(s). That is, a student needs to be able to see all of the documents they have uploaded through the form, as well as any associated metadata. Students should not be allowed to view submissions of other students. Teachers need only higher level submission data, such as which students have submitted evidence, how often, etc. However, after submitting a form, the submitting user typically has no way of seeing submitted data since all data is simply saved into the form owner's account (i.e. Google Drive). So we could either have a single form owned by Quaker Valley IT and somehow grant visibility of submitted data to students, or each student owns a copy of the form and we somehow make a record of form submissions available for the teachers. The latter solution was a non-starter both for the sheer complexity of having dozens of copies of the form (and associated maintenance headaches when you want to update form content), but it's also much less clear how a student-owned form could record data into an entity owned by Quaker Valley IT without exposing a security risk. We decided to have a single Google Form, owned by Quaker Valley IT, and simply extend its functionality so that form submission data gets copied to the Google account of the submitting user. Google makes adding functionality to a Google Form easy with their Apps Script technology. Apps Script Google's Apps Script enables you to extend functionality of existing Google tools/services as well as easily integrate with other services/systems. For a Google Form, you can attach code which gets triggered upon every form submission and which has access to all submitted form data, including details about the submitting user. For our evidence upload form, we simply needed a way to copy submitted data from the form owner's account (i.e. Quaker Valley IT Admin) into the student's account. This immediately suggests two requirements:
Data submitted to Google Forms is typically anonymous, with an option of asking for an email address. However, a form created within a Google Workspace account--such as the one used by Quaker Valley--can be configured to require that user be authenticated with their Google account and also enforce that only users within that organization are allowed to view/submit the form. That latter restriction is exactly what we needed for our purposes: not only can we prevent users outside of Quaker Valley from submitting the form, we can know exactly which user is submitting. Furthermore, Quaker Valley IT has write access to all of its student Google accounts. The high-level flow of the form submission works like this, and is illustrated in the diagram below:
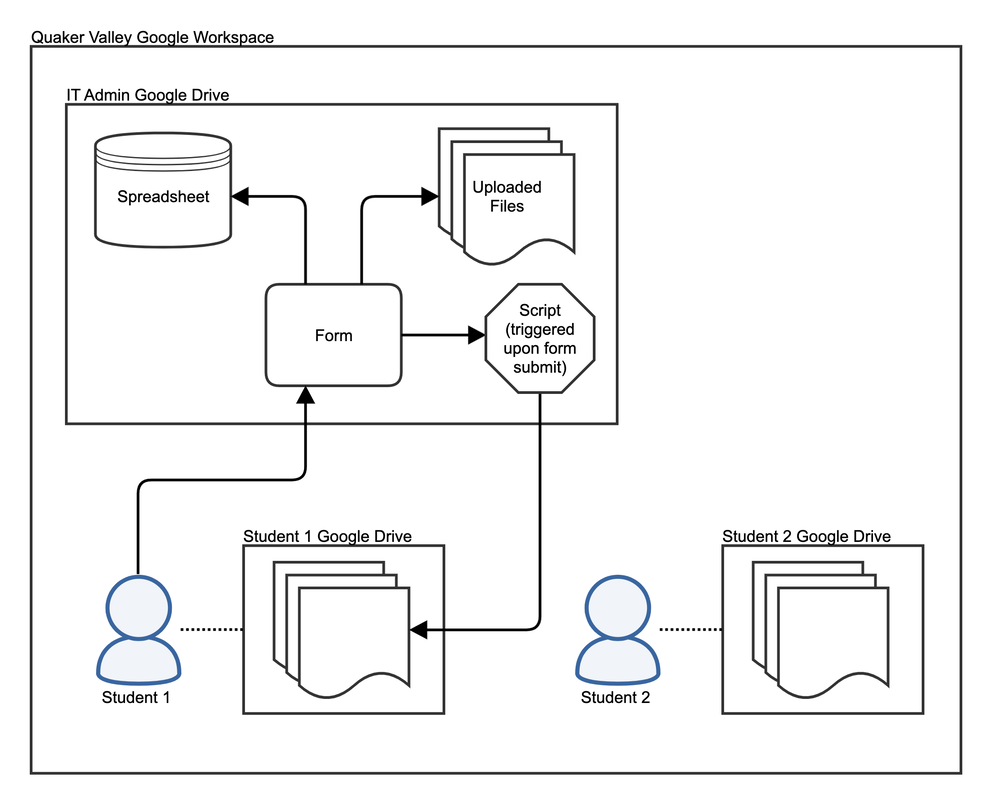 With the combination of the form and triggered script, we've satisfied the needs of both teachers and students:
Submission Visualization It's important for students to be able to track their progress towards achieving micro-credentials, and to be able to quickly spot any deficiencies, or areas which may be too heavily weighted. Although the solution described above does provide a student with a record of all data they have uploaded through the form, it's much harder to get a sense of progress over time. To remedy that, we sought to add a visualization component that could provide both a timeline view and a graph view. Requirements The visualization component had a number of requirements:
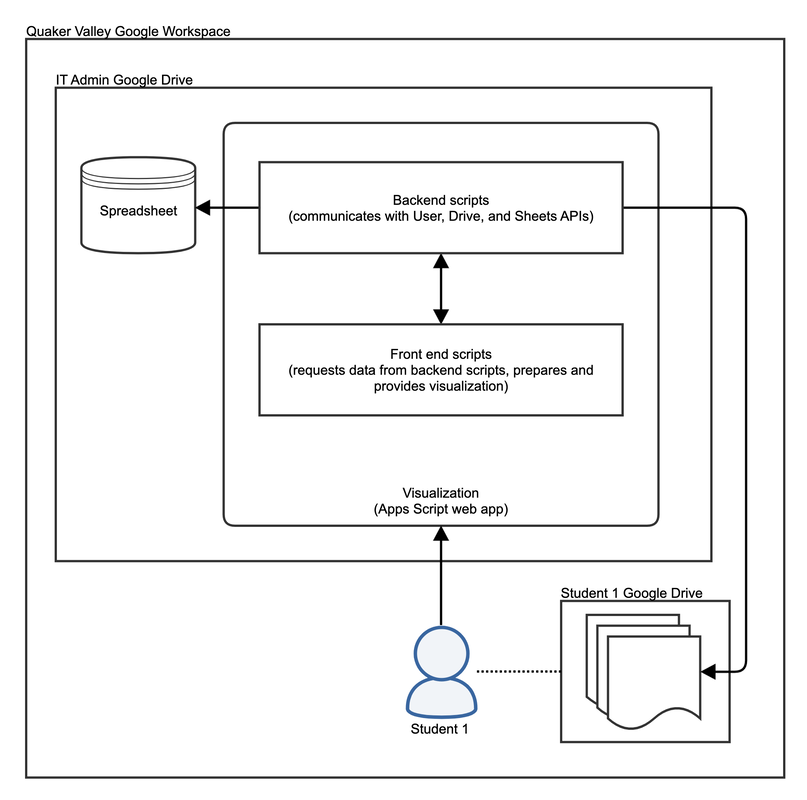
Solution Given the requirements, it was immediately apparent that we needed to leverage the same Google account infrastructure and simply provide a way to read a summary of submitted data for the user. This could have been achieved with the site hosted externally, where students log in with their Quaker Valley Google account (e.g. via OAuth2), and then have backend API calls fetch data to be presented in the visualization. However, such an approach is not only needlessly complex, it would also require additional hosting and thus increased cost and maintenance. Google's Apps Script platform provides an easy and (mostly) elegant solution: it provides a way to create Apps Script web apps. These web apps are simply collections of code hosted in an Apps Script project and published (with options for versioning, should you want to have separate staging and production versions) to execute whenever someone visits the web app's URL (the URL resulting from publishing is long and cryptic, thus my assessment of it as a mostly elegant solution...but pretty URLs are easy to create with HTTP or DNS redirection). Furthermore, since it's code hosted within Google's Apps Script infrastructure, integration with any other Google service is available through well-documented and powerful APIs. The underlying data required for the timeline and graph views is the same--it's merely the presentation that differs. The high-level flow of the visualization works like this, and is illustrated in the diagram below:
 Timeline Visualization As shown in the screenshot below, the timeline view presents a student's SDL form submissions in a timeline, grouped by evidence type and collection date. Although Google's Charts API is excellent and varied, its timeline charts fell short of our vision for presenting the data. We instead used the open-source timeline.js JavaScript library for the timeline, applying a fair amount of UI modifications via custom CSS. A student can pan the timeline left and right, or click the left and right arrows, to move backward and forward in time. Clicking any of the colored "lollipops" in the grey timeline area jumps to that point in time and presents a summary of the submission(s) in the area above. Submissions which included an uploaded file have a small arrow which you can click on to view the file. Finally, the evidence types in the legend at the top are clickable, to allow filtering of the timeline by evidence type. 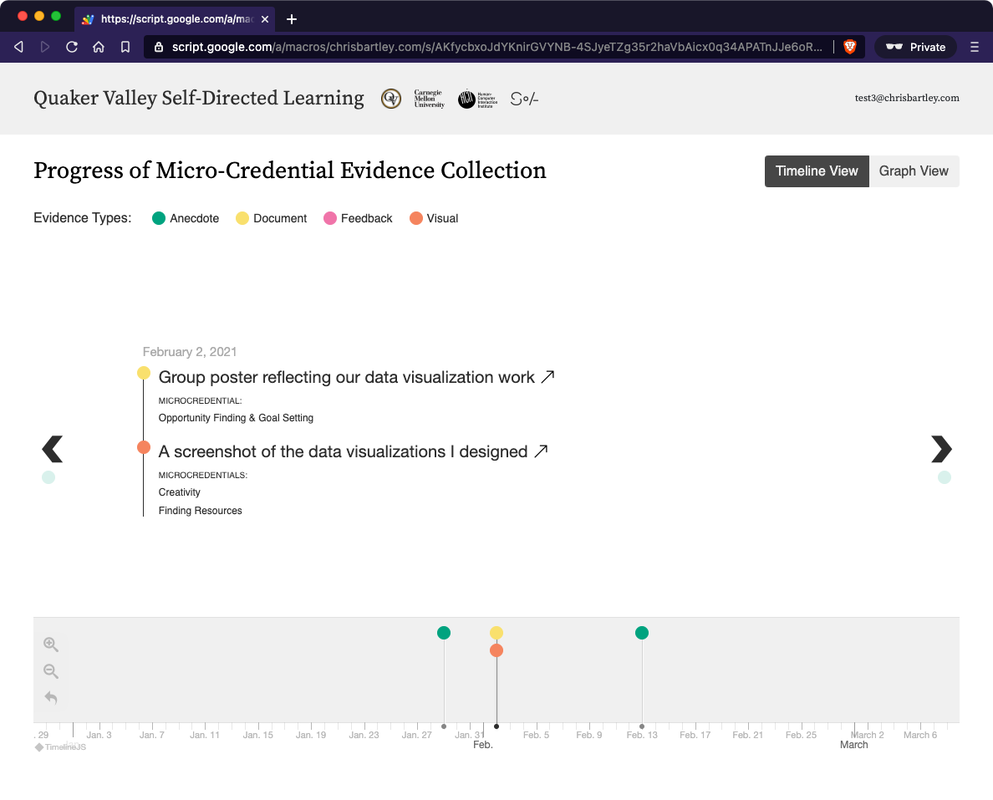 Graph Visualization As shown in the screenshot below, the graph view presents a student's SDL form submissions as a line chart, grouped by micro-credential and collection date. Nodes in the chart are clickable to view details about the SDL submission, and items in the legend can be toggled to filter the chart by micro-credential. 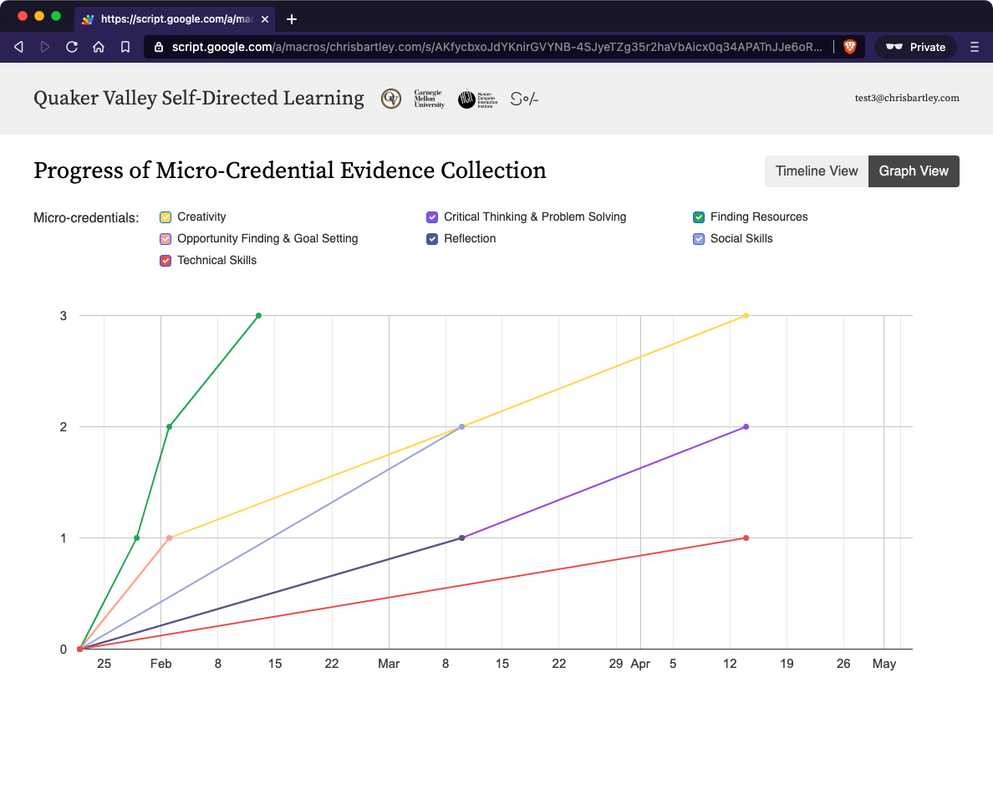 Potential Improvements There are a few areas we seek to improve with future iterations of the system:
0 Comments
Leave a Reply. |
Blog chronicling project activities and student work.
Areas
All
Archives
May 2021
|
 RSS Feed
Project info |
COLLABORATORS
|
CoDESIGN PARTNERS
|
This material is based upon work supported by the National Science Foundation under Grant No. 1736189 "Smart Spaces for Making: Networked Physical Tools to Support Process Documentation and Learning."
Any opinions, findings, and conclusions of recommendations expressed in this material are those of the author(s) and do not necessarily reflect the views of the National Science Foundation.
Any opinions, findings, and conclusions of recommendations expressed in this material are those of the author(s) and do not necessarily reflect the views of the National Science Foundation.